Picture this. Your team just redesigned the sign-up button. It’s now bigger, bolder, and a different color. Your manager is convinced it will boost conversions. Everyone’s excited. But two weeks after launch, the numbers haven’t moved. Was the redesign a failure? Or maybe it was never properly tested in the first place?
That’s exactly the kind of situation A/B testing is built for. And as an analyst, understanding how it works not just in theory, but in practice is one of the most valuable things you can have in your toolkit.
So, what actually is A/B testing?
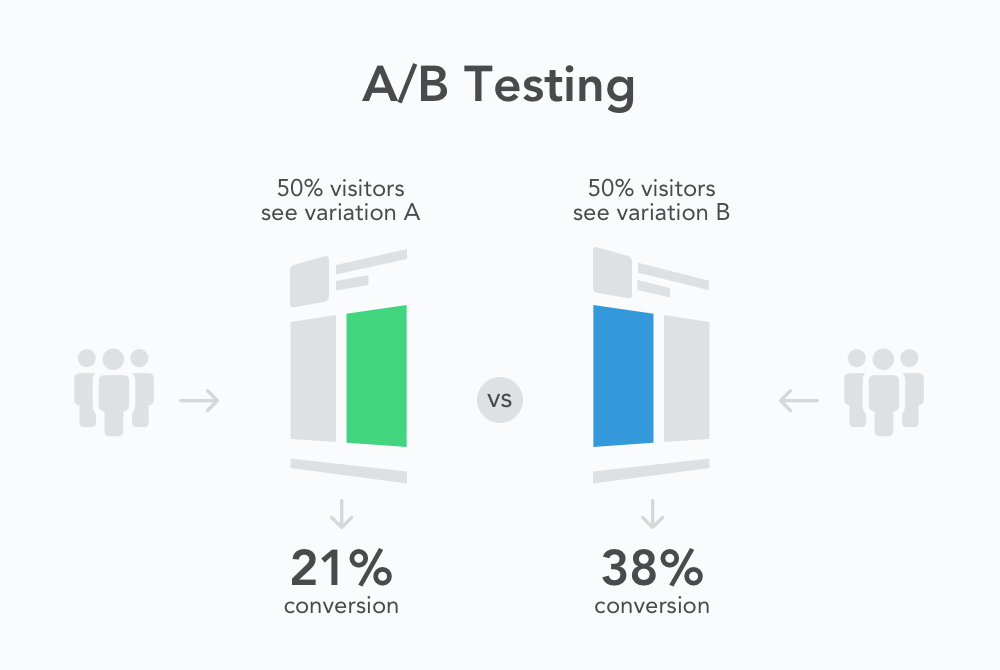
At its core, A/B testing is a way of comparing two versions of something to see which one performs better. Version A is usually what already exists the control. Version B is the new thing you want to try the variant. You split your audience randomly, show each group one version, and then measure what happens.
The key word there is randomly. That randomness is what makes the test reliable. Without it, you’re not really comparing the same thing. You might be comparing morning users to evening users, or mobile users to desktop users, without even realizing it.
Think of it like a coin flip. You’re not trying to predict which side lands up you’re creating the fairest possible conditions to let the data decide.
How to set one up, step by step
Running an A/B test well isn’t complicated, but there’s a sequence that matters. Skip a step and you risk drawing conclusions from bad data.
- Define what you’re trying to improve. Before you change anything, pick one metric you care about click rate, sign-ups, time on page, whatever matters most. If you try to measure everything at once, you’ll end up measuring nothing clearly.
- Form a hypothesis. Don’t just test things randomly. Have a reason. “We believe changing X will increase Y because Z.” That reasoning forces you to think before you act, and it helps you learn something useful even when the test doesn’t go the way you expected.
- Decide on your sample size before you start. This is the step most analysts skip, and it’s one of the most important. Use a sample size calculator to figure out how many users you need before you can trust the results. Running a test on 200 people and calling it done is how you end up making decisions based on noise.
- Run the test simultaneously. Show version A and version B at the same time, not one after the other. Running them sequentially means your results are polluted by time-based factors — seasonality, news events, day of the week, all of it.
- Wait for the test to finish. Set a timeline upfront and stick to it. Checking results every few hours and stopping early when you see something exciting is called “peeking,” and it’s one of the fastest ways to reach the wrong conclusion.
Mistakes that are way more common than they should be
Even experienced analysts fall into these traps. The good news is they’re all avoidable once you know what to look for.
Stopping the test too early. You see version B is winning by 15% after three days and you call it. But that lead disappears by day ten. Early results are almost always noisy. Let the test run its full course.
Testing too many things at once. If you change the headline, the button, and the image at the same time, and the test wins, you won’t know which change actually did it. One variable at a time is the rule.
Ignoring statistical significance. A difference between two numbers is meaningless if it could just be random chance. You need a p-value below a threshold (usually 0.05) to say the result is statistically significant. If your tool doesn’t show this, look it up or calculate it, it matters.
Treating a failed test as a waste of time. If version B didn’t win, that’s still useful information. You learned that your hypothesis was wrong. That’s data. Document it, share it, and use it to build a better next test.
One question to leave you with
A/B testing is not complicated at heart. It’s just a structured way of asking a question and letting real behavior answer it. The process above will get you most of the way there. The rest is practice running tests, making mistakes, and getting better at reading what the data is actually telling you versus what you want it to tell you.
But here’s what I’d ask you to sit with: how many decisions has your team made in the last six months that felt data-driven, but were never actually tested? And if you’d run a proper A/B test on even one of them what do you think you might have found?